Let us be honest.
Most 10 to 20-person SMEs are not short of effort.
They are short of visibility.
The team is busy.
Orders are coming in.
Revenue looks acceptable.
But if I ask:
“Is operations healthy right now?”
The answer is usually vague.
‘Healthy’ is not a feeling.
It is a set of numbers.
And in a small business, you don’t need many.
You need the right operations metrics for SMEs… tracked consistently.
Not 25 KPIs…
Not a dashboard circus…
…Just the numbers that actually move the business.
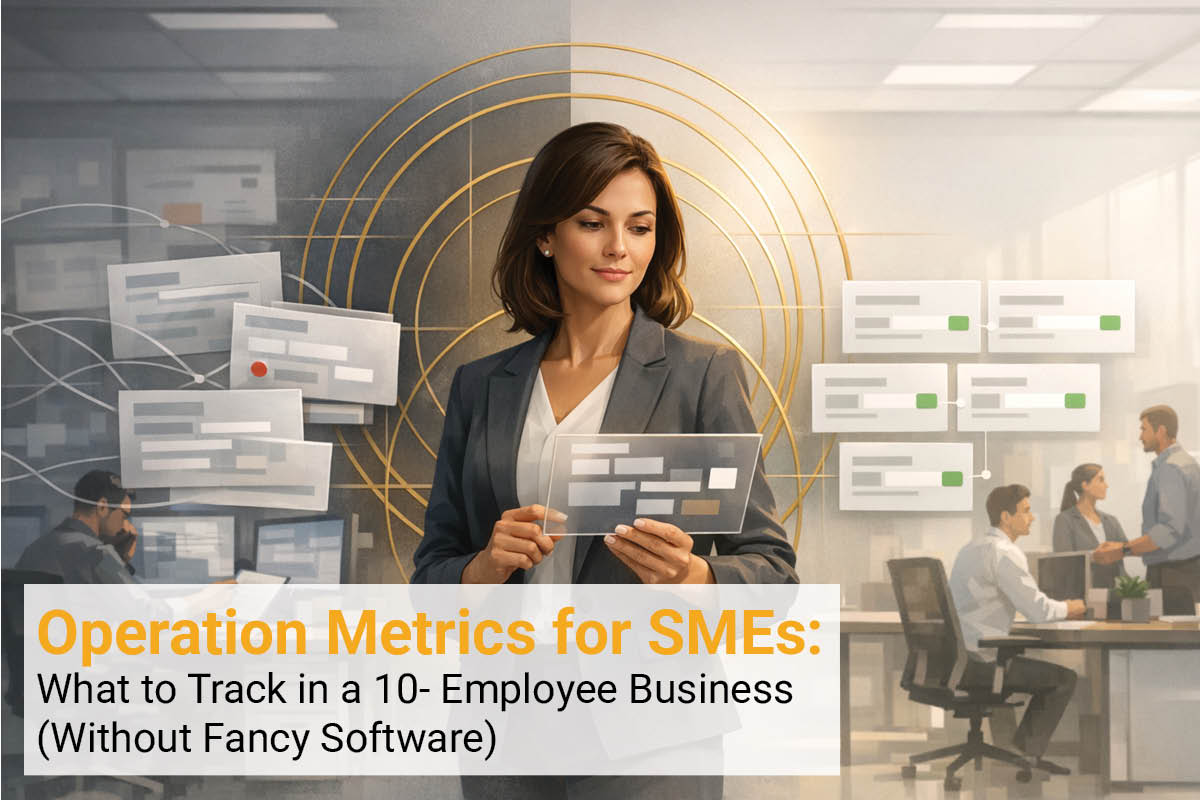
What Operations Metrics Actually Mean in a Small SME
In a 10-person business, operations metrics are not corporate scorecards.
They are simple indicators that tell you three things:
- Is work moving?
- Is work profitable?
- Is the team overloaded?
If your metrics don’t answer these, they are just noise.
Small business operations metrics should support decisions.
Not impress visitors.
While large enterprises track hundreds of KPIs, SMEs benefit from focusing on fewer operational indicators, see a general definition of key performance indicators here.
But in many SMEs, the real problem is not the number of metrics.
It is that work moves across departments without clear visibility.
I wrote about how these cross-department gaps in SMEs quietly slow operations and create hidden bottlenecks.
Why Most SMEs Track the Wrong Things
Here is what usually gets tracked:
- Revenue.
- Bank balance.
- Enquiries.
All useful… None sufficient.
Revenue tells you what happened.
It does not tell you whether delivery is efficient.
Enquiries show interest.
They don’t show operational strength.
Bank balance hides inefficiencies very well… until it doesn’t.
When founders feel stressed, but numbers look fine, it is almost always because the wrong numbers are being tracked.
The 6 Operations Metrics That Actually Matter
In a 10–employee SME, these are the ones that make a difference.
Nothing fancy.
1. Lead-to-Conversion Ratio
(Are opportunities turning into real work?)
- How many enquiries came in?
- How many converted?
If 40 enquiries became 12 jobs, your conversion rate is 30%.
This ratio tells you more about operational alignment than revenue does.
If enquiries rise but conversions don’t, something is off:
- Pricing.
- Proposal clarity.
- Follow-up discipline.
Operational Reality:
In industries like construction, industrial supply, or large technical projects, enquiries may convert 1–3 years later.
So don’t measure conversion by calendar year alone.
Instead:
- Track quotes submitted.
- Track wins from those quotes over their lifecycle.
- Review the win ratio per tender type.
If 10 contractors bid for one project, your baseline probability is already 10%.
The goal is not 50% conversion. The goal is to discipline bidding and improve the relative win rate.
Operations metrics for SMEs must reflect business reality, not spreadsheet convenience.
2. Active Work-in-Progress (WIP)
(How much is currently open?)
Count active jobs.
Not “how busy it feels.”
Actual number.
Too many open jobs? Bottlenecks are forming.
Too few? Capacity is idle.
WIP is one of the simplest small business operations metrics… and one of the most revealing.
3. Gross Margin Per Job
(Is the work worth doing?)
Revenue minus direct cost.
Simple.
Many SMEs grow revenue and quietly shrink margins.
That is not growth.
That is pressure building.
Track margin per job or per product.
Review monthly at a minimum.
Operational Reality:
Sometimes you accept a lower-margin job strategically.
- To enter a new market.
- To keep production running.
- To unlock larger downstream orders.
That is fine.
But label it clearly as strategic. Measure its actual margin. And define what benefit you expect from it.
If the follow-on opportunity never comes, it was not a strategy. It was optimism.
Metrics don’t remove strategy. They make strategy visible.
4. Average Cycle Time
(How long does work take?)
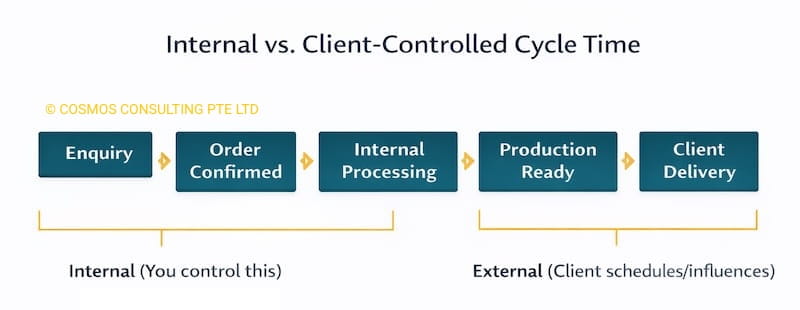
From confirmed order to delivery.
Track average days.
Long cycle time affects:
- Cash flow.
- Client trust.
- Team fatigue.
Reducing cycle time often increases capacity without hiring.
Operational Reality:
In many SMEs, clients request phased delivery or extended timelines.
So separate what you control from what you don’t.
Measure:
- Internal processing time (from order to production-ready).
- Client-driven delivery timeline separately.
If you mix both, you blame yourself for delays that aren’t operational.
Operations metrics for SMEs should measure controllable efficiency.
5. Pending / Waiting Items
(Where is work stuck?)
How many jobs are waiting for:
- Client approvals?
- Internal decisions?
- Materials?
- Payment?
A simple count.
When pending items rise, chaos follows two weeks later.
This is a powerful visibility metric in small business operations, and this is the metric most SMEs ignore.
6. Weekly Capacity Snapshot
(Is the team overloaded?)
List each team member.
Note estimated weekly capacity.
Note allocated work.
No time-tracking software required.
Just awareness.
If two people are at 140% and one is at 60%, the problem is not productivity.
It is allocation.
Operational reality:
For shop floor teams, capacity may be measured in machine hours or man-hours.
For office staff – sales, admin, project managers – precision is less important than load visibility.
– List active projects per person.
– Estimate effort level.
– Look for an imbalance.
Capacity measurement in small business operations metrics is directional, not scientific.
Over-precision paralyses SMEs.
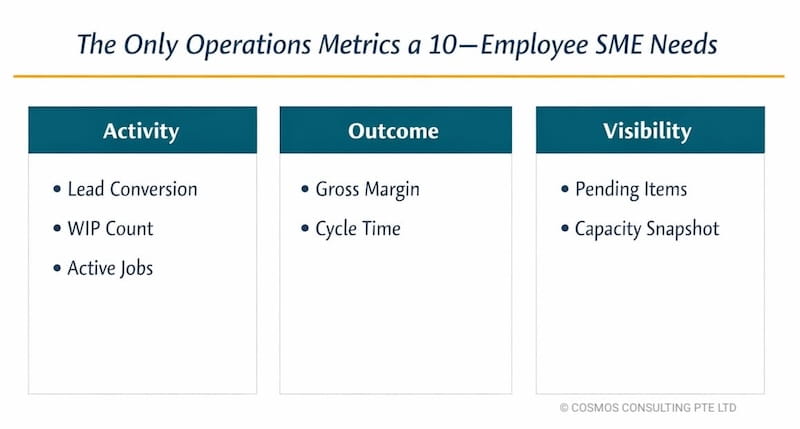
Activity. Outcome. Visibility.
Here is the discipline most SMEs lack.
You must track:
- Activity metrics
- Outcome metrics
- Visibility metrics
Most businesses track only outcomes.
But by the time the outcome dips, damage is already done.
Visibility metrics enable you to identify pressure early.
That is the difference between reacting and leading.
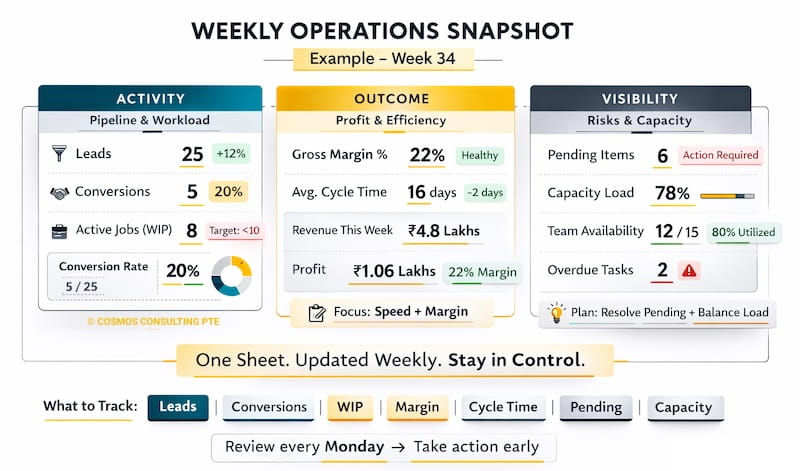
How to Track Without Fancy Software
You need structure.
Create one simple weekly sheet and group your metrics under three headings:
Activity
- Leads
- Conversions (with %)
- Active Jobs (WIP)
Outcome
- Gross Margin %
- Average Cycle Time
Visibility
- Pending Items
- Capacity Load %
Do not scatter them across tabs. Do not track them in isolation.
Group them exactly like this.
Then update once a week.
Not daily. Not obsessively.
Hold a 30-minute weekly operations review.
Same day. Same time.
Open the sheet and review in order:
- Activity: Is the pipeline feeding work properly?
- Outcome: Is work profitable and moving at the right speed?
- Visibility: Where is pressure building?
Four questions are enough:
- What moved?
- What is stuck?
- Where is the margin slipping?
- Who is overloaded?
No slides… No dashboards…
No performance theatre.
Just visible numbers and operational decisions.
Software amplifies clarity. It does not create it.
A Real SME Pattern
In one 12-person technical SME I worked inside, revenue was rising.
On paper, things looked healthy.
In reality, the founder was exhausted.
We tracked just three numbers:
- Cycle time: 22 days.
- Pending approvals: 14 open jobs.
- Capacity load: Two engineers, consistently overloaded.
The numbers did not fix anything by themselves.
But they exposed patterns we were previously arguing about.
We could see that:
- Jobs were sitting in approval longer than expected.
- Engineers were being assigned work before earlier tasks were closed.
- Small delays were compounding into long cycle times.
So we made simple adjustments:
- Cleared pending approvals every Friday.
- Capped active jobs per engineer.
- Stopped starting new work until bottlenecks reduced.
Within six weeks:
- Cycle time reduced to 15 days.
- Pending approvals halved.
- Revenue improved without hiring.
No new software. No restructuring.
Just disciplined operations metrics for SMEs to make visible decisions.
Why Dashboards Usually Fail in Small Businesses
Many founders jump to software too early.
- Dashboards.
- ERP systems.
- Analytics tools.
But dashboards magnify confusion if the underlying metrics are unclear.
If you don’t know which numbers matter, software will only give you more numbers.
Operations metrics for SMEs must be defined before they are digitised.
Clarity first. Tools later…only if needed.
Where This Fits in Systems Thinking
Inside the COSMOS 4S Systems Framework™, metrics belong in the Systems layer.
Structure defines responsibility.
SOPs define execution.
Systems create visibility.
Without visibility, scale is luck.
With visibility, scale becomes controlled.
Start Smaller Than You Think
If this feels like too much, begin with three numbers:
- Active jobs.
- Average margin.
- Pending items.
Track for four weeks.
You will see patterns.
Patterns lead to decisions.
Decisions lead to stability.
That is how a 10-person SME becomes scalable.
Operations metrics for SMEs are not about sophistication.
They are about operational awareness.
- Start simple.
- Track consistently.
- Review weekly.
Clarity builds confidence.
And confidence scales better than chaos.
If You are Not Sure What to Track
Every SME is different.
A trading company will not track the same operations metrics as a project-based engineering firm.
But the discipline is the same.
If you are unsure which 3–5 operations metrics for SMEs truly matter in your business, don’t start with software.
Start by mapping how work actually flows through your company, from enquiry to delivery to payment.
When flow becomes visible, the right numbers become obvious.
Clarity first.
Then systems.
Then scale.